traceroute
A comprehensive guide to tracing the route packets take to a destination
Traceroute Command in Linux
Introduction
The traceroute command is a powerful network diagnostic tool used to trace the path that packets take from your system to a destination host. It provides valuable insights into the network infrastructure between two points, showing each hop along the route and measuring the round-trip time for packets to reach each hop. This information is crucial for network administrators and users troubleshooting connectivity issues, analyzing network performance, or simply understanding the topology of the internet.
Unlike the simpler ping command which only tests if a destination is reachable, traceroute reveals the entire journey of packets through the network, making it an essential tool for comprehensive network diagnostics.
How Traceroute Works
Traceroute operates by sending packets with incrementally increasing Time-To-Live (TTL) values:
- It begins by sending a packet with a TTL of 1
- When this packet reaches the first router, the TTL is decremented to 0
- The router discards the packet and sends back an ICMP "Time Exceeded" message
- Traceroute records this router's address and the time taken
- The process repeats with TTL values of 2, 3, and so on until the destination is reached
- The final result is a list of all routers (hops) along the path to the destination
By default, traceroute sends UDP packets on Linux (while Windows' tracert uses ICMP Echo requests). However, modern versions of traceroute can use different protocols based on the options specified.
Basic Syntax
The basic syntax of the traceroute command is:
Where:
- options: Various flags that modify the behavior of the command
- destination: The target host, which can be specified as a domain name or an IP address
Installation
Traceroute is not installed by default in many Linux distributions. To install it:
On Debian/Ubuntu-based systems:
On Red Hat/CentOS/Fedora systems:
or
Basic Usage
Simple Traceroute
To perform a basic traceroute to a destination:
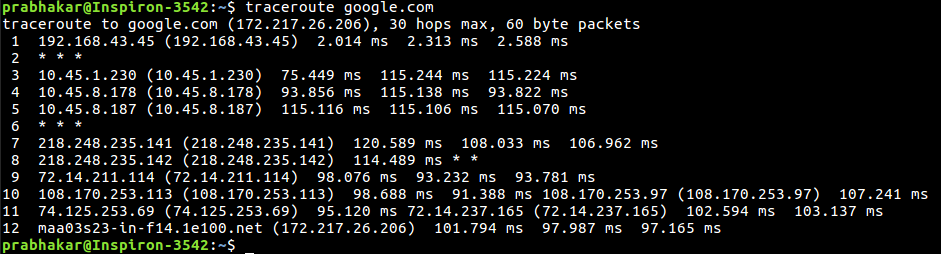
This command traces the route to google.com, displaying each hop along the path with its IP address, hostname (if available), and round-trip times for packets.
Understanding the Output
A typical traceroute output looks like this:
Each line represents a hop along the route:
- The first column is the hop number
- The second column shows the hostname and IP address of the router
- The last three columns show the round-trip time for three separate probe packets
An asterisk (*) indicates that the probe timed out (no response was received within the timeout period).
Advanced Options
1. Using IPv4 or IPv6
To explicitly use IPv4:
To use IPv6:
2. Preventing Packet Fragmentation
The -F option prevents packet fragmentation:
This is useful when troubleshooting issues related to Maximum Transmission Unit (MTU) size.
3. Starting from a Specific TTL
To start tracing from a specific hop rather than the first one:
This command starts tracing from the 5th hop, which is useful when you're only interested in the later parts of a route.
4. Routing Through a Specific Gateway
To route packets through a specific gateway:
This forces packets to go through the specified gateway, which can be useful for testing specific routing paths.
5. Setting Maximum Hops
By default, traceroute limits the trace to 30 hops. To change this limit:
This sets the maximum number of hops to 15.
6. Disabling Hostname Resolution
For faster results, you can disable the resolution of IP addresses to hostnames:
This displays only IP addresses, which can significantly speed up the traceroute process.
7. Specifying Destination Port
To use a specific destination port:
This sends probes to port 80 instead of the default high-numbered ports.
8. Adjusting the Number of Probes
By default, traceroute sends three probes per hop. To change this:
This sends only one probe per hop, making the trace faster but potentially less reliable.
9. Setting Packet Size
To change the size of the probe packets:
This sets the packet size to 100 bytes.
Practical Applications
1. Network Troubleshooting
Traceroute is invaluable for identifying where network problems occur:
If you see consistent timeouts or high latency at a specific hop, that router or the link to it might be experiencing issues.
2. Analyzing Network Performance
By examining the round-trip times between hops, you can identify performance bottlenecks:
Using more probes per hop (5 in this example) provides more reliable latency measurements.
3. Understanding Network Topology
Traceroute helps visualize the network path between your system and a destination:
This can reveal how traffic is routed through different ISPs and backbone networks.
4. Verifying Routing Changes
After network changes, traceroute can confirm that traffic is following the expected path:
5. Security Auditing
Security professionals use traceroute to understand potential attack paths and network exposure:
Interpreting Common Issues
1. Consistent Timeouts (*)
If you see asterisks for all probes at a particular hop:
This could indicate:
- The router is configured not to respond to TTL-exceeded messages
- A firewall is blocking the probes or responses
- The router is experiencing issues
2. Increasing Latency
If you notice a sudden increase in latency between two hops:
This could indicate:
- A geographical jump (e.g., crossing an ocean)
- Network congestion
- A lower-bandwidth link
3. Asymmetric Routes
Sometimes the return path differs from the outbound path, which can lead to confusing results. This is normal in modern networks.
4. Route Changes During Trace
If you see the route changing during a trace:
This indicates load balancing or dynamic routing changes.
Alternatives to Traceroute
1. MTR (My Traceroute)
MTR combines the functionality of traceroute and ping, providing continuous statistics:
2. Tracepath
Tracepath is similar to traceroute but doesn't require root privileges:
3. Paris Traceroute
Paris Traceroute is designed to handle load-balanced paths better than standard traceroute:
Troubleshooting Traceroute Issues
1. Incomplete Traces
If traceroute doesn't reach the destination:
- Try increasing the maximum hop count:
traceroute -m 60 destination - Check if the destination is actually reachable:
ping destination - Try using a different protocol:
traceroute -I destination(uses ICMP instead of UDP)
2. Permission Issues
If you get "Operation not permitted" errors:
- Run traceroute with sudo:
sudo traceroute destination - Or use tracepath which doesn't require root privileges:
tracepath destination
3. Slow Traces
If traceroute is taking too long:
- Disable hostname resolution:
traceroute -n destination - Reduce the number of probes per hop:
traceroute -q 1 destination - Reduce the wait time:
traceroute -w 2 destination
Command Options Reference
| Option | Description |
|---|---|
-4 | Use IPv4 only |
-6 | Use IPv6 only |
-F | Do not fragment packets |
-f first_ttl | Start from the specified TTL |
-g gateway | Route packets through the specified gateway |
-I | Use ICMP ECHO instead of UDP datagrams |
-m max_ttl | Set the maximum number of hops |
-n | Do not resolve IP addresses to hostnames |
-p port | Use the specified destination port |
-q nqueries | Set the number of probes per hop |
-T | Use TCP SYN for probes |
-w waittime | Set the time to wait for a response |
--help | Display help information |
Conclusion
The traceroute command is an essential tool for network diagnostics, providing valuable insights into the path that packets take across networks. By understanding how to use traceroute and interpret its output, network administrators and users can effectively troubleshoot connectivity issues, analyze network performance, and gain a deeper understanding of network topology.
While traceroute has some limitations, particularly with modern networks that may block or rate-limit ICMP or UDP traffic, it remains one of the most useful tools for network diagnostics. Combined with other networking tools like ping, mtr, and tcpdump, traceroute forms a comprehensive toolkit for network analysis and troubleshooting.
Test Your Knowledge
Take a quiz to reinforce what you've learned
Exam Preparation
Access short and long answer questions for written exams