iftop
A comprehensive guide to monitoring real-time bandwidth usage by connection with iftop
iftop Command
Introduction
iftop is a free and open-source command-line system monitoring utility that displays a frequently-updated list of network bandwidth usage broken down by individual host connections. Unlike other bandwidth monitoring tools that show bandwidth usage by process or interface, iftop focuses on showing the bandwidth consumed by individual TCP/IP connections.
The name "iftop" is derived from "interface top," similar to how the popular "top" command displays process activity. Just as "top" provides real-time information about processes, iftop provides real-time information about network connections.
iftop is particularly useful for network administrators and system engineers who need to:
- Identify which connections are consuming the most bandwidth
- Monitor network usage patterns in real-time
- Troubleshoot network congestion issues
- Detect unusual network activity
Installation
iftop is not typically installed by default on most Linux distributions, but it's available in the standard repositories.
Debian/Ubuntu-based Systems
Red Hat/CentOS/Fedora Systems
Arch Linux
From Source
If iftop is not available in your distribution's repositories, you can compile it from source:
Basic Usage
To start iftop with default settings, simply run:
Root privileges (sudo) are required because iftop needs to put the network interface into promiscuous mode to capture packets.
Specifying a Network Interface
By default, iftop monitors the first available network interface. To specify a particular interface, use the -i option:
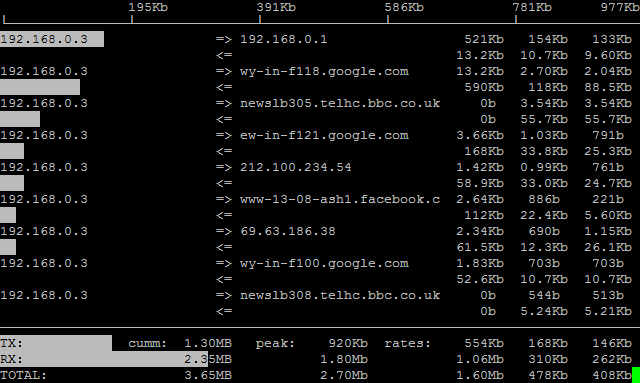
Understanding the Display
The iftop display consists of several sections:
- Header: Shows the interface being monitored and the total bandwidth usage
- Connection List: Shows individual connections sorted by bandwidth usage
- Statistics Bars: Shows graphical representation of traffic over time
- Summary: Shows cumulative bandwidth statistics
- Legend: Shows the meaning of various symbols and abbreviations
Connection List Format
Each line in the connection list shows:
Where:
- Source Host: The local or source IP address/hostname
- Destination Host: The remote or destination IP address/hostname
- TX: Data transmitted from source to destination
- RX: Data received from destination to source
- TOTAL: Total bandwidth (TX + RX)
Traffic Statistics
At the bottom of the display, iftop shows three rows of cumulative statistics:
- TX: Total transmitted bandwidth
- RX: Total received bandwidth
- TOTAL: Combined bandwidth
Each row shows three values:
- Last 2s: Average over the last 2 seconds
- Last 10s: Average over the last 10 seconds
- Last 40s: Average over the last 40 seconds
Advanced Options
Filtering Traffic
iftop allows you to filter the displayed traffic using Berkeley Packet Filter (BPF) syntax, similar to tcpdump:
Display Options
iftop offers several options to customize the display:
Bandwidth Scale
By default, iftop automatically scales the bandwidth units. You can force specific units:
Packet Direction
You can filter traffic based on direction:
Interactive Commands
While iftop is running, you can use various keyboard commands to control the display:
Display Controls
h: Display helpq: Quit iftopp: Pause the displayb: Toggle the display of the bar graphsB: Toggle the display of bandwidth in bytes/bitsn: Toggle hostname resolutionN: Toggle port resolutions: Toggle display of source hostd: Toggle display of destination hostt: Cycle through the display modes (2-line, 1-line, and classic)
Sorting Controls
o: Cycle through the sort options1: Sort by first column (source/destination)2: Sort by second column (source/destination)3: Sort by third column (bandwidth)
Filtering Controls
l: Set a filter code (using BPF syntax)L: Clear the filterf: Edit the filter code
Scrolling
jor↓: Scroll downkor↑: Scroll upSpace: Scroll down one page
Practical Examples
Monitoring Specific Interface Traffic
To monitor traffic on a specific network interface:
Identifying Bandwidth-Heavy Services
To identify which services are consuming the most bandwidth:
This shows port numbers, helping you identify the services.
Monitoring Traffic to External Networks
To monitor traffic between your local network and the internet:
This filters out internal traffic within your local 192.168.0.0/16 network.
Monitoring Specific Protocol Traffic
To monitor only HTTP and HTTPS traffic:
Detecting Unusual Network Activity
To detect potential data exfiltration or unusual connections:
This shows outgoing connections with port numbers, helping identify unexpected outbound traffic.
Monitoring DNS Traffic
To monitor DNS queries and responses:
Combining Multiple Options
You can combine multiple options for more specific monitoring:
This monitors the eth0 interface, doesn't resolve hostnames, shows port numbers, displays bandwidth in bytes, and excludes SSH traffic.
Troubleshooting
Common Issues
"Error opening interface: Permission denied"
This occurs when running iftop without sufficient privileges:
"Interface not found"
This happens when specifying a non-existent interface:
"No suitable devices found"
This can occur when no network interfaces are available for monitoring:
High CPU Usage
iftop can consume significant CPU resources on busy networks:
Comparison with Similar Tools
iftop vs. nethogs
- iftop: Shows bandwidth usage by connection (host pairs)
- nethogs: Shows bandwidth usage by process
iftop vs. nload
- iftop: Shows bandwidth usage by connection
- nload: Shows total bandwidth usage on an interface without breaking it down by connection
iftop vs. bmon
- iftop: Focuses on connection-level bandwidth usage
- bmon: Provides more detailed interface statistics and can monitor multiple interfaces simultaneously
iftop vs. tcpdump
- iftop: Provides a real-time visual display of bandwidth usage
- tcpdump: Captures and displays packet contents for detailed analysis
Best Practices
Efficient Monitoring
- Use specific filters: Narrow down the traffic you're monitoring to reduce resource usage
- Monitor specific interfaces: Only monitor the interfaces relevant to your investigation
- Disable name resolution: Use the
-noption to disable hostname resolution for better performance - Use appropriate update intervals: Adjust the update interval based on your monitoring needs
Security Considerations
- Be mindful of sensitive data: iftop can display connection information that might include sensitive destinations
- Use in trusted environments: Running network monitoring tools should be done in environments where you have authorization
- Consider encryption: Remember that iftop only shows connection metadata, not the content of encrypted traffic
Conclusion
iftop is a powerful and flexible tool for real-time network bandwidth monitoring at the connection level. Its ability to break down bandwidth usage by individual connections makes it invaluable for network troubleshooting, performance optimization, and security monitoring.
By mastering iftop's various options and filters, system administrators and network engineers can gain valuable insights into network traffic patterns and quickly identify bandwidth-intensive connections or potential network issues.
Whether you're diagnosing network congestion, monitoring server traffic, or investigating unusual network activity, iftop provides the visibility needed to understand what's happening on your network at the connection level.
Test Your Knowledge
Take a quiz to reinforce what you've learned
Exam Preparation
Access short and long answer questions for written exams