tcpdump
A comprehensive guide to packet analysis with the tcpdump command
Tcpdump Command in Linux
Introduction
The tcpdump command is a powerful packet analyzer tool used in Linux and Unix-like operating systems. It allows system administrators, network engineers, and security professionals to capture and inspect network traffic at a packet level. By examining these packets, users can troubleshoot network issues, analyze protocols, monitor network activity, and detect security threats.
As a command-line utility, tcpdump provides detailed insights into the data flowing through network interfaces. It can capture packets based on various criteria, display them in human-readable format, and save them for later analysis. This makes it an essential tool for understanding network behavior and diagnosing connectivity problems.
How Tcpdump Works
Tcpdump works by putting a network interface into "promiscuous mode," which allows it to capture all packets passing through the interface, not just those addressed to the host. It uses the libpcap library to capture packets and provides various options to filter, display, and analyze the captured data.
The tool can:
- Capture packets from specified network interfaces
- Filter packets based on various criteria (protocol, port, host, etc.)
- Display packet headers and contents in different formats
- Save captured packets to files for later analysis
- Read previously captured packet files
Installation
Tcpdump is often pre-installed on many Linux distributions. If it's not available on your system, you can install it using your distribution's package manager:
For Debian/Ubuntu-based systems:
For Red Hat/CentOS/Fedora systems:
To verify the installation:
Basic Syntax
The basic syntax of the tcpdump command is:
Where:
- options: Various flags that modify the behavior of tcpdump
- expression: A filter expression to select which packets to capture
Basic Usage
Capturing Packets from Default Interface
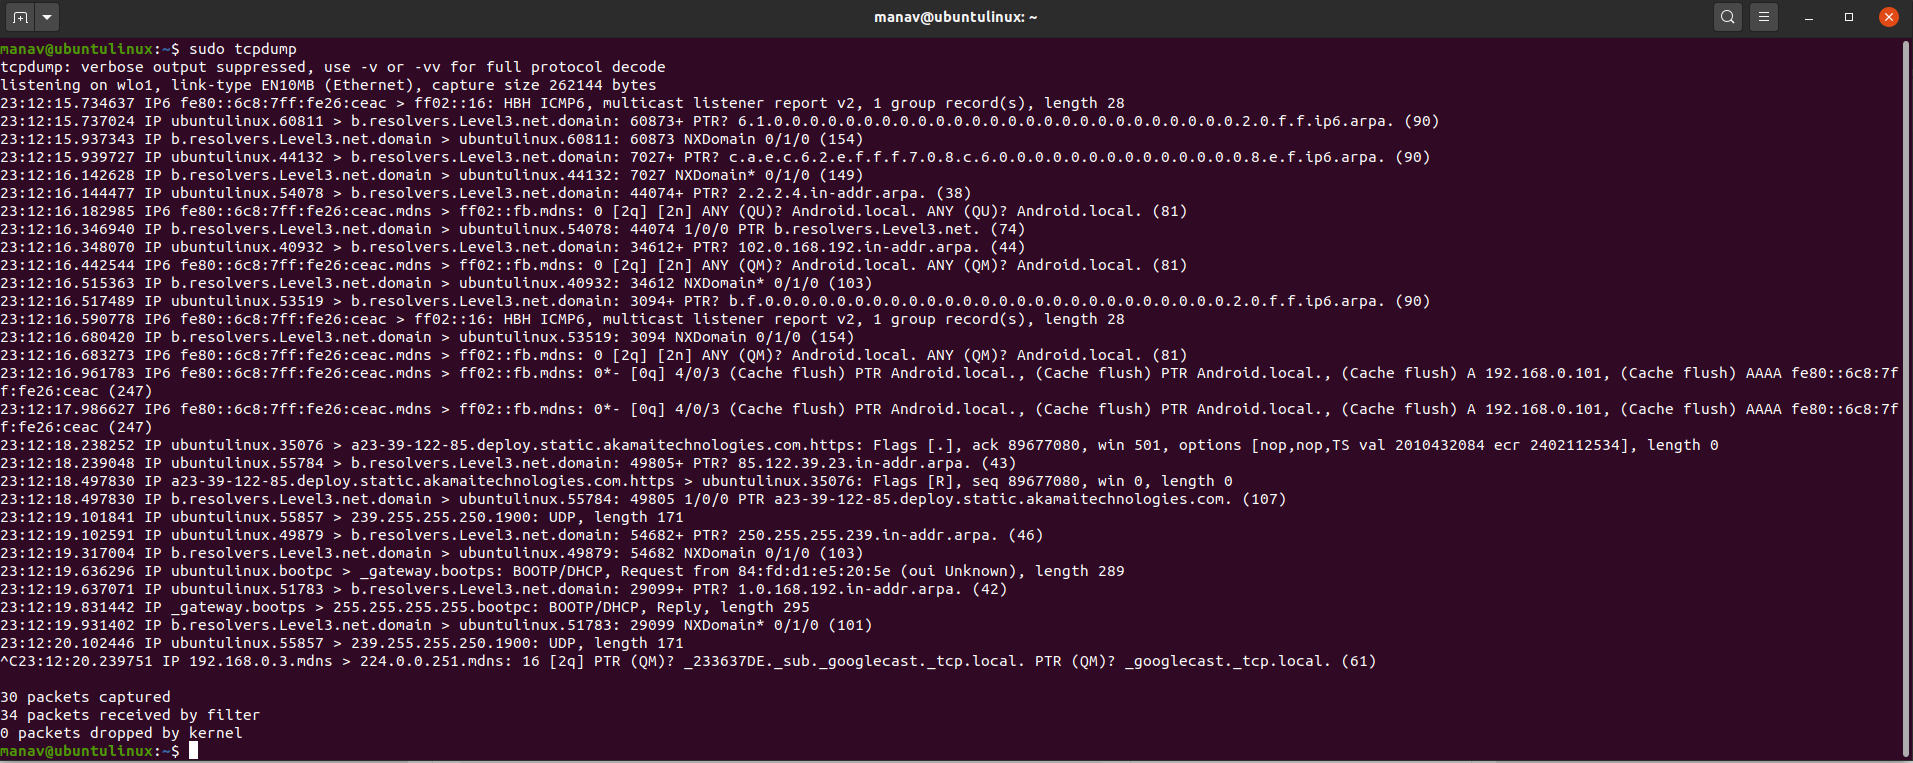
To capture packets from the default network interface:
This command will display packet information until you press Ctrl+C to stop it. Note that tcpdump requires root privileges to capture packets.
Capturing Packets from a Specific Interface
To capture packets from a specific network interface:
Replace eth0 with your interface name.
Listing Available Interfaces
To see all available network interfaces:
Limiting the Number of Packets
To capture a specific number of packets:
This captures only 10 packets and then stops.
Displaying Packets in ASCII
To display packet contents in ASCII format:
Displaying Packets in Hex and ASCII
To display packet contents in both hexadecimal and ASCII format:
Advanced Usage
Saving Captured Packets to a File
To save captured packets to a file for later analysis:
This creates a file in the PCAP (Packet Capture) format, which can be analyzed using tcpdump or other tools like Wireshark.
Reading Packets from a File
To read and display packets from a previously saved file:
Capturing Packets with IP Addresses (No Name Resolution)
To display IP addresses instead of hostnames:
This speeds up the display by avoiding DNS lookups.
Capturing Specific Protocol Packets
To capture only packets of a specific protocol:
This captures only TCP packets. You can replace tcp with other protocols like udp, icmp, etc.
Capturing Packets on Specific Ports
To capture packets on a specific port:
This captures all packets on port 80 (HTTP).
Capturing Packets from or to a Specific Host
To capture packets from or to a specific host:
Combining Filters with Logical Operators
You can combine multiple filters using logical operators:
This captures TCP packets on port 80 from or to the host 192.168.1.1.
Capturing Packets with Specific TCP Flags
To capture packets with specific TCP flags:
This captures packets with SYN or FIN flags set.
Practical Examples
Example 1: Monitoring HTTP Traffic
To monitor HTTP traffic:
This captures full-sized packets (-s 0) on interface eth0, displays them in ASCII format (-A), and filters for TCP traffic on port 80.
Example 2: Capturing DNS Queries
To capture DNS queries:
This captures UDP traffic on port 53 (DNS) on interface eth0.
Example 3: Monitoring SSH Connections
To monitor SSH connections:
This captures all TCP traffic on port 22 (SSH).
Example 4: Capturing Traffic Between Two Hosts
To capture traffic between two specific hosts:
Example 5: Saving Captured Packets with Timestamp
To save captured packets with a timestamp in the filename:
This creates a file with a name like "capture-20230101-123045.pcap".
Understanding Tcpdump Output
A typical tcpdump output line looks like this:
This output includes:
- Timestamp: 13:42:52.192928
- Protocol: IP
- Source: 192.168.1.5.56789 (IP address and port)
- Destination: 192.168.1.1.80 (IP address and port)
- Flags: [S] (SYN flag is set)
- Sequence number: 1000000000
- Window size: 64240
- TCP options: mss 1460, sackOK, etc.
- Packet length: 0
Filter Expressions
Tcpdump uses Berkeley Packet Filter (BPF) syntax for its filter expressions. Here are some common filter expressions:
Protocol Filters
ether: Ethernet framesip: IPv4 packetsip6: IPv6 packetsarp: ARP packetstcp: TCP packetsudp: UDP packetsicmp: ICMP packets
Direction Filters
src: Source addressdst: Destination address
Port Filters
port: Source or destination portsrc port: Source portdst port: Destination port
Host Filters
host: Source or destination hostsrc host: Source hostdst host: Destination host
Network Filters
net: Network addresssrc net: Source networkdst net: Destination network
Logical Operators
andor&&: Logical ANDoror||: Logical ORnotor!: Logical NOT
Common Options Reference
| Option | Description |
|---|---|
-i interface | Specify the network interface to capture packets from |
-c count | Capture only a specific number of packets |
-n | Don't convert addresses to names |
-nn | Don't convert addresses or port numbers to names |
-w file | Write captured packets to a file |
-r file | Read packets from a file |
-A | Print packets in ASCII |
-X | Print packets in hex and ASCII |
-XX | Print packets in hex and ASCII, including the Ethernet header |
-v | Verbose output |
-vv | More verbose output |
-vvv | Even more verbose output |
-s snaplen | Capture snaplen bytes of data from each packet (0 for full packets) |
-S | Print absolute TCP sequence numbers |
-e | Print the Ethernet header |
-q | Quick (quiet) output |
-t | Don't print timestamp |
-tttt | Print timestamp in default format with date |
-D | List available interfaces |
Security Considerations
When using tcpdump, consider the following security aspects:
-
Permissions: Tcpdump requires root privileges to capture packets, which can be a security risk if misused.
-
Sensitive Data: Captured packets may contain sensitive information like passwords or personal data. Handle capture files securely.
-
Network Load: Extensive packet capturing can increase network load and affect performance.
-
Promiscuous Mode: When capturing in promiscuous mode, tcpdump can see all traffic on the network segment, which might violate privacy policies.
-
Encrypted Traffic: While tcpdump can capture encrypted traffic (like HTTPS), it cannot decrypt the contents without the appropriate keys.
Integration with Other Tools
Tcpdump works well with other networking and security tools:
Wireshark
Tcpdump can save captures in PCAP format, which can be opened and analyzed in Wireshark for a more detailed graphical analysis:
Grep
You can pipe tcpdump output to grep for filtering:
The -l option makes the output line-buffered for better piping.
Tshark
Tshark, the command-line version of Wireshark, can be used with tcpdump captures:
Troubleshooting with Tcpdump
Diagnosing Connectivity Issues
To check if packets are reaching a host:
Then try to connect to the remote host from another terminal.
Identifying Network Bottlenecks
To identify which connections are generating the most traffic:
Detecting Port Scans
To detect potential port scans:
This captures TCP SYN packets without the ACK flag, which is typical of port scanning.
Conclusion
Tcpdump is an invaluable tool for network administrators, security professionals, and anyone who needs to understand network traffic at a packet level. Its flexibility, power, and detailed output make it perfect for troubleshooting network issues, monitoring traffic, and analyzing protocols.
While it has a steep learning curve due to its complex filter syntax and output format, mastering tcpdump provides deep insights into network behavior that are difficult to obtain with other tools. Whether you're diagnosing connectivity problems, investigating security incidents, or simply learning about network protocols, tcpdump is an essential addition to your toolkit.
Test Your Knowledge
Take a quiz to reinforce what you've learned
Exam Preparation
Access short and long answer questions for written exams