mtr
A comprehensive guide to combining ping and traceroute with the mtr command
MTR Command in Linux
Introduction
The mtr (My TraceRoute) command is a powerful network diagnostic tool that combines the functionality of ping and traceroute into a single, interactive utility. Unlike traditional network tools that provide static output, mtr continuously updates its display in real-time, giving you live insights into network performance and connectivity issues.
This makes mtr particularly valuable for system administrators, network engineers, and anyone troubleshooting network problems. It provides a comprehensive view of the entire route between your system and a destination, showing packet loss, latency, and other metrics for each hop along the path.
How MTR Works
MTR works by sending a series of ICMP echo requests (similar to ping) to each router along the path to a destination. It then measures:
- Round-trip time (RTT) for each hop
- Packet loss at each point in the network
- Standard deviation of response times, indicating jitter or inconsistency
The tool continuously updates these statistics, allowing you to observe network behavior over time and identify patterns that might not be apparent from a single trace or ping.
Installation
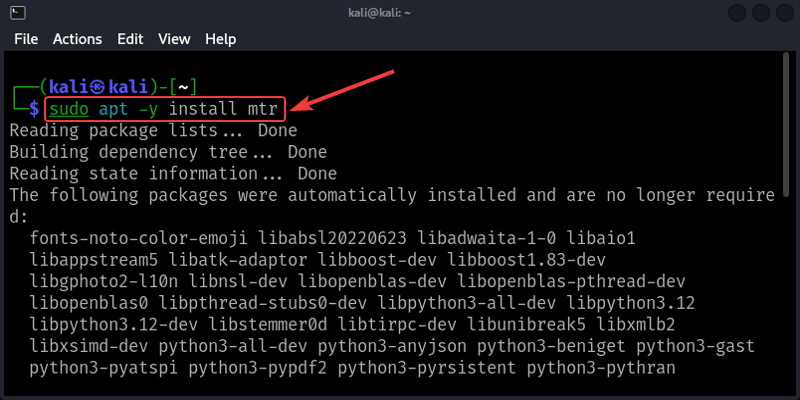
MTR is not installed by default on many Linux distributions. To install it:
On Debian/Ubuntu-based systems:
On Red Hat/CentOS/Fedora systems:
or
Basic Usage
The basic syntax for using mtr is:
For example, to start a basic MTR trace to Google's DNS server:
This will launch the interactive interface, which continuously updates until you press q to quit.
Understanding the MTR Output
A typical MTR display includes:
The columns in the output represent:
- Host: The hostname or IP address of each hop
- Loss%: Percentage of packet loss at this hop
- Snt: Number of packets sent
- Last: The RTT of the last packet sent (in milliseconds)
- Avg: Average RTT (in milliseconds)
- Best: Best (lowest) RTT observed (in milliseconds)
- Wrst: Worst (highest) RTT observed (in milliseconds)
- StDev: Standard deviation of RTTs (in milliseconds)
A row of question marks (???) indicates that a hop did not respond to ICMP requests, which is common as some routers are configured to ignore or rate-limit ICMP traffic.
Advanced Options
1. IPv4 Only Mode
To force MTR to use only IPv4:
This is useful when you want to ensure that the trace follows IPv4 routes, especially on dual-stack systems.
2. IPv6 Only Mode
Similarly, to force MTR to use only IPv6:
3. Display IP Addresses Only
To show IP addresses instead of hostnames:
This speeds up the trace by skipping DNS resolution.
4. Combining Options
You can combine options for more specific traces:
This runs an IPv4-only trace, showing IP addresses instead of hostnames (-n), and using the best (lowest) RTT values (-b).
5. Report Mode
For a non-interactive, one-time report:
This sends 10 packets to each hop (-c 10) and generates a report (-r) instead of launching the interactive interface.
6. Changing the Packet Size
To change the size of the packets sent:
This sends 100-byte packets instead of the default size.
7. Changing the Interval Between Packets
To adjust how frequently packets are sent:
This sends a packet every 0.5 seconds instead of the default 1 second.
8. TCP Mode
To use TCP SYN packets instead of ICMP:
This is useful when ICMP is blocked but TCP is allowed.
9. UDP Mode
To use UDP packets:
10. JSON Output
For programmatic processing:
This outputs the results in JSON format.
Practical Applications
1. Troubleshooting Network Connectivity Issues
MTR is invaluable for identifying where packet loss or latency is occurring in a network path:
By sending 100 packets, you can get a more reliable picture of where issues might be occurring.
2. Monitoring Network Performance Over Time
Run MTR in a terminal window while performing other tasks to observe how network performance changes:
This allows you to correlate network issues with specific activities or times of day.
3. Comparing Different Network Paths
Run MTR to multiple destinations to compare performance:
Then compare the results to identify common bottlenecks or differences in routing.
4. Documenting Network Issues for ISP Support
Generate a report to share with your ISP when reporting issues:
This creates a comprehensive report with 60 packets per hop that you can attach to support tickets.
5. Verifying VPN or Proxy Routing
Check if your traffic is correctly routing through a VPN or proxy:
The first few hops should show your VPN or proxy server's network if properly configured.
Interpreting MTR Results
1. Identifying Packet Loss
Packet loss at a specific hop doesn't necessarily mean there's a problem at that hop. Look for these patterns:
- Loss at a single hop followed by 0% loss at subsequent hops: The hop is likely just dropping ICMP packets but forwarding your actual traffic.
- Loss that continues through all subsequent hops: This indicates a genuine problem at the hop where loss begins.
2. Analyzing Latency
- Sudden large increases in latency: Often indicate crossing major network boundaries (e.g., from your LAN to your ISP, or crossing continents).
- High standard deviation (StDev): Indicates inconsistent performance, which can cause issues for real-time applications like VoIP or gaming.
3. Understanding Timeouts
A timeout (shown as ???) doesn't always indicate a problem:
- Many routers are configured to not respond to ICMP or to rate-limit responses
- Some networks intentionally hide their internal routing
4. Asymmetric Routing
MTR only shows the forward path. Return traffic might take a different route, which can sometimes explain unexpected behavior.
Comparison with Other Tools
| Tool | Advantages | Disadvantages |
|---|---|---|
| MTR | Combines ping and traceroute, real-time updates, comprehensive statistics | More complex output, requires installation on some systems |
| Ping | Simple, universally available, good for basic connectivity testing | Only tests end-to-end connectivity, no path information |
| Traceroute | Shows the complete path, widely available | Static output, less detailed statistics, slower |
| Pathping (Windows) | Detailed statistics similar to MTR | Slower, not real-time, Windows-only |
Troubleshooting MTR Issues
1. Permission Issues
If you get "Operation not permitted" errors:
MTR requires root privileges on some systems to send raw packets.
2. No Response from Hops
If you see many hops with no response (???):
- Try using TCP mode:
mtr -T example.com - Some networks block ICMP but allow TCP
3. MTR Shows Problems but Applications Work Fine
This often happens because:
- Applications use TCP/UDP, while MTR typically uses ICMP
- Try using MTR in TCP mode:
mtr -T -P 80 example.com
4. High Packet Loss at Intermediate Hops
This is often normal. Many routers prioritize forwarding traffic over responding to ICMP. Focus on the final destination's statistics.
Conclusion
The mtr command is a powerful and versatile network diagnostic tool that combines the best features of ping and traceroute. Its real-time updates and comprehensive statistics make it invaluable for troubleshooting network issues, monitoring performance, and understanding the path your traffic takes across networks.
By mastering MTR and learning to interpret its output correctly, you can quickly identify where network problems are occurring, gather evidence for ISP support tickets, and gain deeper insights into network behavior. Whether you're a system administrator, network engineer, or just trying to figure out why your internet connection is slow, MTR is an essential tool in your diagnostic arsenal.
Test Your Knowledge
Take a quiz to reinforce what you've learned
Exam Preparation
Access short and long answer questions for written exams