nload
A comprehensive guide to monitoring real-time network traffic with nload
nload Command
Introduction
nload is a console-based network monitoring utility that displays the current network traffic usage in real time. Unlike more complex tools that break down traffic by connection or process, nload focuses on providing a simple, clear visualization of the total incoming and outgoing bandwidth on network interfaces.
The tool presents network traffic using easy-to-read graphs and provides additional statistics such as total transferred data, min/max/average bandwidth usage, and more. This makes nload particularly useful for quickly assessing network performance and identifying bandwidth issues without the complexity of more detailed analysis tools.
nload is designed with simplicity in mind, making it ideal for:
- System administrators who need to quickly check network utilization
- Users troubleshooting network performance issues
- Server monitoring in environments where graphical tools aren't available
- Quick verification of bandwidth usage during network operations
Installation
nload is available in the standard repositories of most Linux distributions.
Debian/Ubuntu-based Systems
Red Hat/CentOS/Fedora Systems
Arch Linux
From Source
If nload is not available in your distribution's repositories, you can compile it from source:
Basic Usage
To start nload with default settings, simply run:
Unlike some other network monitoring tools, nload doesn't require root privileges for basic functionality.
Monitoring Specific Interfaces
By default, nload displays the first available network interface. To specify a particular interface:
To monitor multiple interfaces, you can specify them as additional arguments:
When monitoring multiple interfaces, you can switch between them using the left and right arrow keys.
Understanding the Display
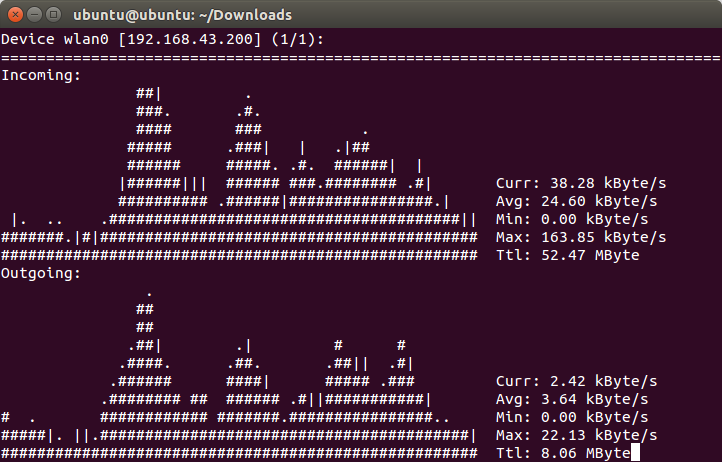
The nload display consists of two main sections for each network interface:
Incoming Traffic (Top Section)
- Graph: Visual representation of incoming bandwidth usage over time
- Current: Current incoming bandwidth
- Average: Average incoming bandwidth since nload started
- Min/Max: Minimum and maximum incoming bandwidth observed
- Total: Total amount of data received since nload started
Outgoing Traffic (Bottom Section)
- Graph: Visual representation of outgoing bandwidth usage over time
- Current: Current outgoing bandwidth
- Average: Average outgoing bandwidth since nload started
- Min/Max: Minimum and maximum outgoing bandwidth observed
- Total: Total amount of data sent since nload started
Status Bar
At the bottom of the screen, nload displays:
- The currently displayed device
- Total number of devices being monitored
- Navigation hints
Command-Line Options
nload offers several command-line options to customize its behavior:
Display Options
Unit Options
Output Format
Interactive Commands
While nload is running, you can use various keyboard commands to control the display:
Navigation
Left Arroworh: Switch to the previous network deviceRight Arroworl: Switch to the next network deviceF5orr: Refresh the display immediatelyF6: Cycle through the available units (bit/s, byte/s, etc.)q: Quit nload
Display Settings
F2: Decrease the refresh intervalF3: Increase the refresh intervalF4: Change the number of data points in the traffic graphs
Practical Examples
Basic Monitoring
To monitor the default network interface:
Monitoring Multiple Interfaces
To monitor both wired and wireless interfaces:
Custom Refresh Rate
For more responsive updates (200ms refresh):
Fixed Scale Graph
To set a fixed maximum scale for the graph (useful for consistent visualization):
Bytes Instead of Bits
To display traffic in bytes per second instead of bits:
Combining Options
You can combine multiple options for customized monitoring:
This sets a 100ms refresh rate, 100 data points in the graph, a maximum scale of 10,000 Kbit/s, and displays traffic in megabytes per second for the eth0 interface.
Advanced Usage
Using nload in Scripts
While nload is primarily an interactive tool, you can use it in non-interactive mode to get a snapshot of current network usage:
This will display a single update and exit, which can be useful for scripting.
Continuous Monitoring with Logging
To log network usage over time, you can combine nload with other tools:
Monitoring Remote Systems
You can use nload over SSH to monitor remote systems:
Troubleshooting
Common Issues
"Device not found"
This occurs when specifying a non-existent interface:
Low Resolution Graphs
If the graphs appear too compressed or lack detail:
Inaccurate Readings
If readings seem inaccurate or inconsistent:
Comparison with Similar Tools
nload vs. iftop
- nload: Shows total bandwidth usage on interfaces with graphs
- iftop: Shows bandwidth usage broken down by connection
nload vs. bmon
- nload: Simpler interface focused on bandwidth graphs
- bmon: More detailed statistics and can monitor multiple interfaces simultaneously in one view
nload vs. nethogs
- nload: Shows bandwidth usage by interface
- nethogs: Shows bandwidth usage by process
nload vs. vnstat
- nload: Real-time monitoring with no persistent data
- vnstat: Collects and stores historical network usage data
Best Practices
Efficient Monitoring
- Adjust refresh rate appropriately: Lower refresh rates provide more detail but consume more CPU
- Monitor specific interfaces: Only monitor the interfaces relevant to your investigation
- Set appropriate scales: Use the
-moption to set a fixed scale for consistent visualization
Performance Considerations
- CPU usage: nload is generally lightweight, but very low refresh intervals can increase CPU usage
- Terminal performance: Large graphs in small terminals may not display correctly
- Remote monitoring: When monitoring over SSH, consider network latency effects on refresh rates
Conclusion
nload is a simple yet powerful tool for monitoring network traffic in real-time. Its straightforward interface and visual graphs make it ideal for quickly assessing network performance without the complexity of more detailed analysis tools.
Whether you're troubleshooting network issues, monitoring server performance, or just curious about your current bandwidth usage, nload provides an intuitive way to visualize network traffic. Its lightweight nature and console-based interface make it particularly valuable in server environments where graphical tools aren't available or practical.
While it doesn't provide the detailed connection-level or process-level information that some other tools offer, nload's focus on simplicity and clarity makes it an essential part of any system administrator's toolkit for quick network monitoring tasks.
Test Your Knowledge
Take a quiz to reinforce what you've learned
Exam Preparation
Access short and long answer questions for written exams