netstat
A comprehensive guide to showing network connections, routing tables, and interface statistics with the netstat command
Netstat Command in Linux
Introduction
The netstat (network statistics) command is a powerful networking tool used in Linux and Unix-like operating systems to display various network-related information. It provides insights into network connections, routing tables, interface statistics, masquerade connections, and multicast memberships. System administrators and network engineers frequently use netstat for network troubleshooting, monitoring, and diagnostics.
Despite being considered deprecated in favor of newer tools like ss, netstat remains widely used due to its simplicity, familiarity, and availability across most Linux distributions. Its comprehensive output helps users understand the state of their network and identify potential issues.
Basic Syntax
The basic syntax of the netstat command is:
Where options are various flags that modify the behavior and output of the command.
Installation
Netstat is typically included in the net-tools package, which is pre-installed on many Linux distributions. If it's not available, you can install it using your distribution's package manager:
For Debian/Ubuntu-based systems:
For Red Hat/CentOS/Fedora systems:
Basic Usage
Displaying All Connections
To display all active connections (both listening and non-listening sockets):
This command shows a comprehensive list of all network connections, including TCP, UDP, and Unix domain sockets.
Displaying TCP Connections
To list only TCP connections:
The -t option filters the output to show only TCP connections.
Displaying UDP Connections
To list only UDP connections:
The -u option filters the output to show only UDP connections.
Displaying Listening Ports
To show only the ports that are in a listening state:
This is useful for identifying which services are actively waiting for connections.
Displaying Listening TCP Ports
To show only TCP ports in a listening state:
Displaying Listening UDP Ports
To show only UDP ports in a listening state:
Displaying Unix Socket Connections
To show Unix domain socket connections:
Displaying Listening Unix Sockets
To show only Unix domain sockets in a listening state:
Advanced Usage
Displaying Numeric Addresses
To display addresses and port numbers in numerical form without resolving hostnames or port names:
This speeds up the command execution as it skips DNS lookups.
Displaying Process Information
To show the process ID (PID) and name of the program to which each socket belongs:
This requires root privileges to display information for all processes. Without root privileges, it will only show information for processes owned by the current user.
Combining Options
Options can be combined for more specific output. For example, to show all TCP connections with numeric addresses and process information:
Displaying Routing Information
To display the kernel routing table:
This is equivalent to the route command.
Displaying Interface Statistics
To show network interface statistics:
This displays information similar to the ifconfig command.
Displaying Extended Interface Information
For more detailed interface information:
Displaying Network Statistics
To show statistics for various network protocols:
You can also filter for specific protocols:
Continuous Display
To update the display every few seconds:
This is useful for monitoring network activity in real-time.
Practical Examples
Finding Processes Using a Specific Port
To identify which process is using port 80 (HTTP):
The options used are:
-t: TCP connections-u: UDP connections-l: Listening sockets-p: Show process information-n: Show numeric addresses
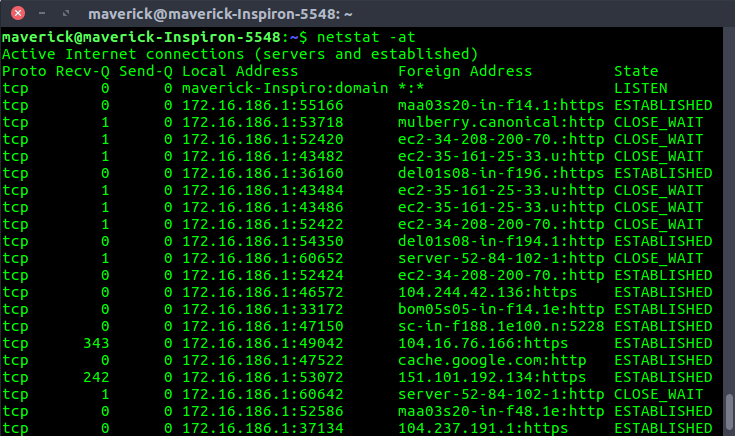
Checking for Established Connections
To see all established TCP connections:
Monitoring Connection States
To count connections by state:
This command counts how many connections are in each state (ESTABLISHED, TIME_WAIT, etc.).
Finding Connections to a Specific IP
To see all connections to a specific IP address:
Checking for Listening Services
To see which services are listening on which ports:
Finding Programs Using a Specific Protocol
To find all programs using SSH:
Checking Network Interface Performance
To monitor network interface performance:
This shows packet statistics for each interface, including errors and drops.
Understanding the Output
Connection Output Format
The standard connection output includes several columns:
- Proto: The protocol (TCP, UDP, etc.)
- Recv-Q: The count of bytes not copied by the user program connected to this socket
- Send-Q: The count of bytes not acknowledged by the remote host
- Local Address: The local end of the socket (address and port)
- Foreign Address: The remote end of the socket (address and port)
- State: The state of the socket (for TCP connections)
Common TCP States
- LISTEN: The socket is listening for incoming connections
- ESTABLISHED: The connection is established and data can be transferred
- TIME_WAIT: The socket is waiting after close to handle packets still in the network
- CLOSE_WAIT: The remote end has shut down, waiting for the socket to close
- SYN_SENT: The socket is actively attempting to establish a connection
- SYN_RECV: A connection request has been received from the network
Routing Table Output Format
The routing table output includes:
- Destination: The destination network or host
- Gateway: The gateway address (an asterisk indicates no gateway is needed)
- Genmask: The netmask for the destination
- Flags: Various routing flags
- MSS: Default maximum segment size for TCP connections
- Window: Default window size for TCP connections
- irtt: Initial round trip time
- Iface: The interface to which packets for this route will be sent
Interface Statistics Output Format
The interface statistics output includes:
- Iface: The interface name
- MTU: Maximum Transmission Unit
- RX-OK/RX-ERR/RX-DRP/RX-OVR: Received packets (OK, errors, dropped, overruns)
- TX-OK/TX-ERR/TX-DRP/TX-OVR: Transmitted packets (OK, errors, dropped, overruns)
Common Options Reference
| Option | Description |
|---|---|
-a | Show all sockets (both listening and non-listening) |
-t | Show TCP connections |
-u | Show UDP connections |
-x | Show Unix domain sockets |
-l | Show only listening sockets |
-n | Show numeric addresses and ports (no name resolution) |
-p | Show the PID and name of the program to which each socket belongs |
-r | Show the kernel routing table |
-i | Show network interface statistics |
-s | Show network statistics by protocol |
-c | Continuously display information |
-e | Display extended information |
-v | Verbose mode |
-o | Include timers |
-M | Show masqueraded connections |
-W | Show RAW sockets |
Netstat vs. SS Command
The ss command is considered the modern replacement for netstat. Here's how they compare:
Advantages of SS over Netstat
- Performance:
ssis faster, especially on systems with many connections - More Information:
sscan display more TCP states and socket information - Active Development:
ssis actively maintained, while netstat is considered deprecated - Direct Access:
ssdirectly accesses kernel data structures rather than parsing/proc
Equivalent Commands
| Netstat Command | SS Equivalent |
|---|---|
netstat -tulpn | ss -tulpn |
netstat -ant | ss -ant |
netstat -r | ip route |
netstat -i | ip -s link |
Despite these advantages, many users still prefer netstat due to familiarity and its availability on most systems.
Troubleshooting with Netstat
Identifying Port Conflicts
If an application fails to start because a port is already in use, you can identify the conflicting process:
This shows which process is using port 8080.
Detecting Unusual Connections
To check for unexpected or potentially malicious connections:
Review the list for connections to unfamiliar IP addresses or unusual programs making network connections.
Monitoring Network Load
To monitor network load on interfaces:
This updates the interface statistics every second, allowing you to observe changes in traffic patterns.
Checking for Network Bottlenecks
High values in the RX-DRP (receive dropped) or TX-DRP (transmit dropped) columns in the interface statistics may indicate network bottlenecks:
Verifying Service Availability
To check if a service is properly listening on the expected port:
This example checks if the Nginx web server is listening on its configured ports.
Security Considerations
When using netstat for security auditing, consider the following:
- Unexpected Listening Ports: Check for services listening on unexpected ports, which could indicate unauthorized services or malware
- Unusual Connections: Look for established connections to suspicious IP addresses
- High Connection Counts: An unusually high number of connections might indicate a DoS attack or compromised system
- Non-Standard Services: Services running on non-standard ports might be attempting to evade detection
Regular monitoring with netstat can help identify potential security issues before they become serious problems.
Conclusion
The netstat command remains a valuable tool for network diagnostics and monitoring in Linux systems. Despite being considered deprecated in favor of newer tools like ss, its simplicity and widespread availability ensure its continued relevance for system administrators and network engineers.
By mastering netstat's various options and understanding its output, users can effectively troubleshoot network issues, monitor system performance, and identify potential security concerns. Whether you're checking for listening services, analyzing connection states, or investigating network performance problems, netstat provides the insights needed to maintain a healthy and secure network environment.
Test Your Knowledge
Take a quiz to reinforce what you've learned
Exam Preparation
Access short and long answer questions for written exams